Kubernetes
|
Docker Desktop: Kubernetes Web UI (Dashboard)
See this page for more details about Kubernetes Web UI (Dashboard):
https://kubernetes.io/docs/tasks/access-application-cluster/web-ui-dashboard/
https://kubernetes.io/docs/tasks/access-application-cluster/web-ui-dashboard/
-
Deploying the Dashboard UI:
See this page for details Helm installation: Install Helm
Add kubernetes-dashboard repository:$ helm repo add kubernetes-dashboard https://kubernetes.github.io/dashboard/
"kubernetes-dashboard" has been added to your repositories
Deploy a Helm Release named "kubernetes-dashboard" using the kubernetes-dashboard chart:$ helm upgrade --install kubernetes-dashboard kubernetes-dashboard/kubernetes-dashboard --create-namespace --namespace kubernetes-dashboard
Release "kubernetes-dashboard" does not exist. Installing it now. NAME: kubernetes-dashboard NAMESPACE: kubernetes-dashboard STATUS: deployed REVISION: 1 TEST SUITE: None NOTES: ************************************************************************************************* *** PLEASE BE PATIENT: Kubernetes Dashboard may need a few minutes to get up and become ready *** ************************************************************************************************* Congratulations! You have just installed Kubernetes Dashboard in your cluster. To access Dashboard run: kubectl -n kubernetes-dashboard port-forward svc/kubernetes-dashboard-kong-proxy 8443:443 NOTE: In case port-forward command does not work, make sure that kong service name is correct. Check the services in Kubernetes Dashboard namespace using: kubectl -n kubernetes-dashboard get svc Dashboard will be available at: https://localhost:8443 -
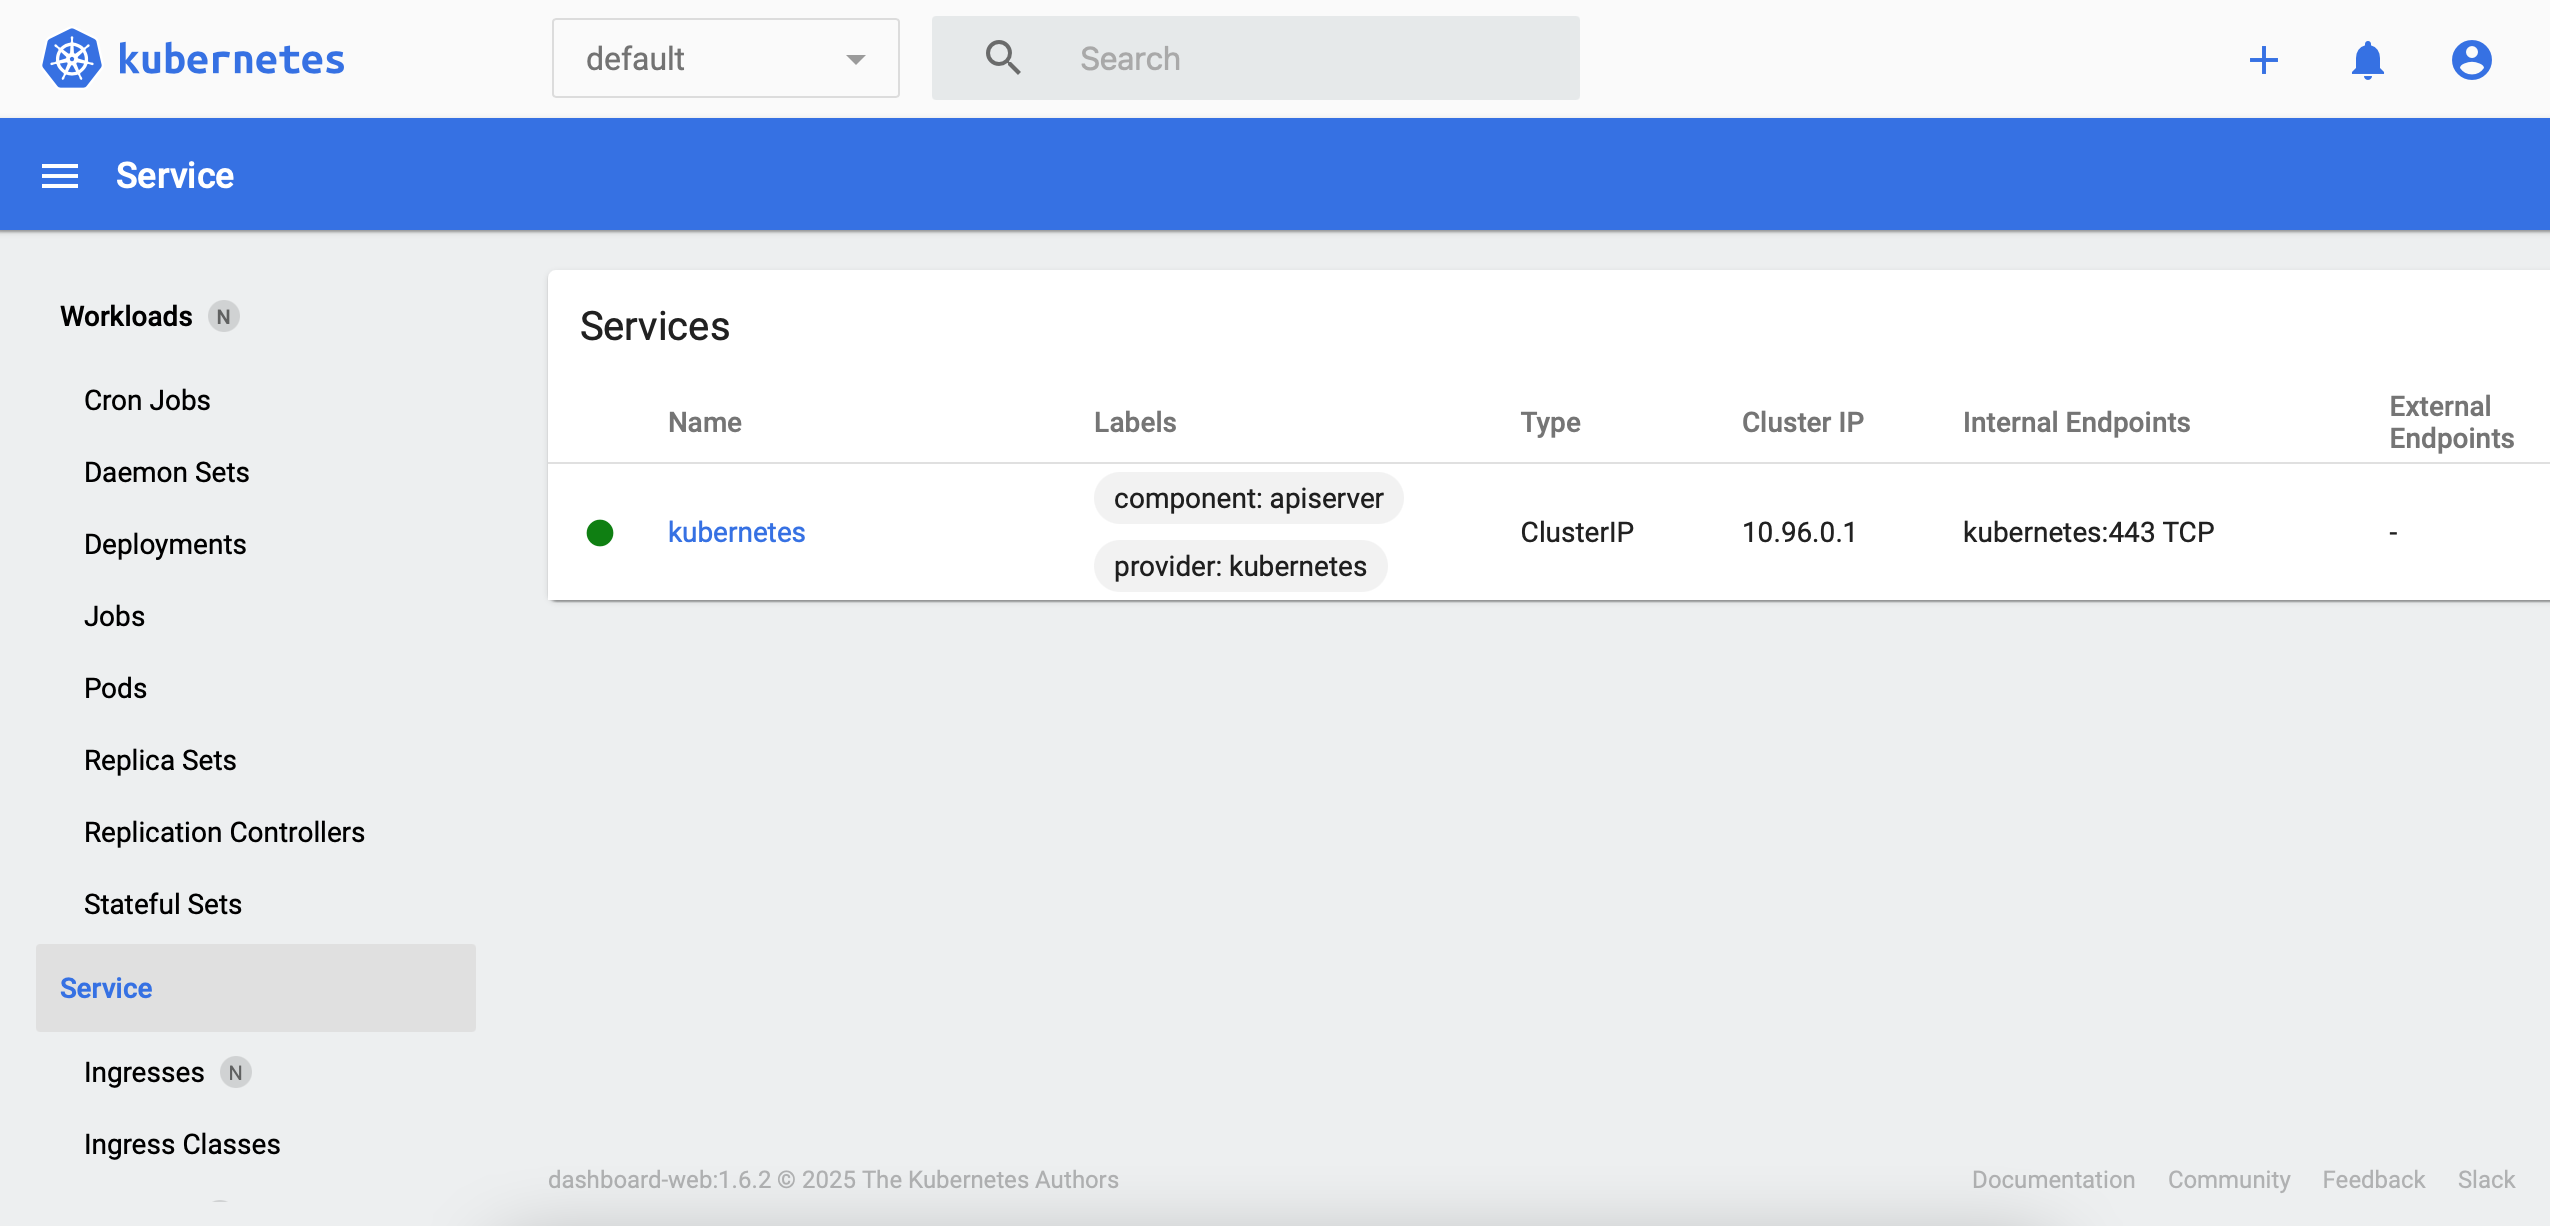
Check the Dashboard Service:
$ kubectl get services -n kubernetes-dashboard -o wide
NAME                        TYPE        CLUSTER-IP     EXTERNAL-IP   PORT(S)    AGE    SELECTOR
kubernetes-dashboard        ClusterIP   10.101.99.76   <none>        443/TCP    7d9h   k8s-app=kubernetes-dashboard
...
-
Check the Dashboard Deployment:
$ kubectl get deployments -n kubernetes-dashboard -o wide
NAME                        READY   UP-TO-DATE   AVAILABLE   AGE    CONTAINERS                  IMAGES                                SELECTOR
kubernetes-dashboard        1/1     1            1           7d9h   kubernetes-dashboard        kubernetesui/dashboard:v2.2.0         k8s-app=kubernetes-dashboard
...
-
Check the Dashboard Pods:
$ kubectl get pods -n kubernetes-dashboard -o wide
NAME                                         READY   STATUS    RESTARTS   AGE    IP           NODE             NOMINATED NODE   READINESS GATES
kubernetes-dashboard-76577bd7bb-22mzj        1/1     Running   0          7d9h   10.1.0.145   docker-desktop   <none>           <none>
...
-
Accessing the Dashboard UI:
$ kubectl port-forward svc/kubernetes-dashboard-kong-proxy 8443:443 -n kubernetes-dashboard
Forwarding from 127.0.0.1:8443 -> 8443
Forwarding from [::1]:8443 -> 8443
Handling connection for 8443
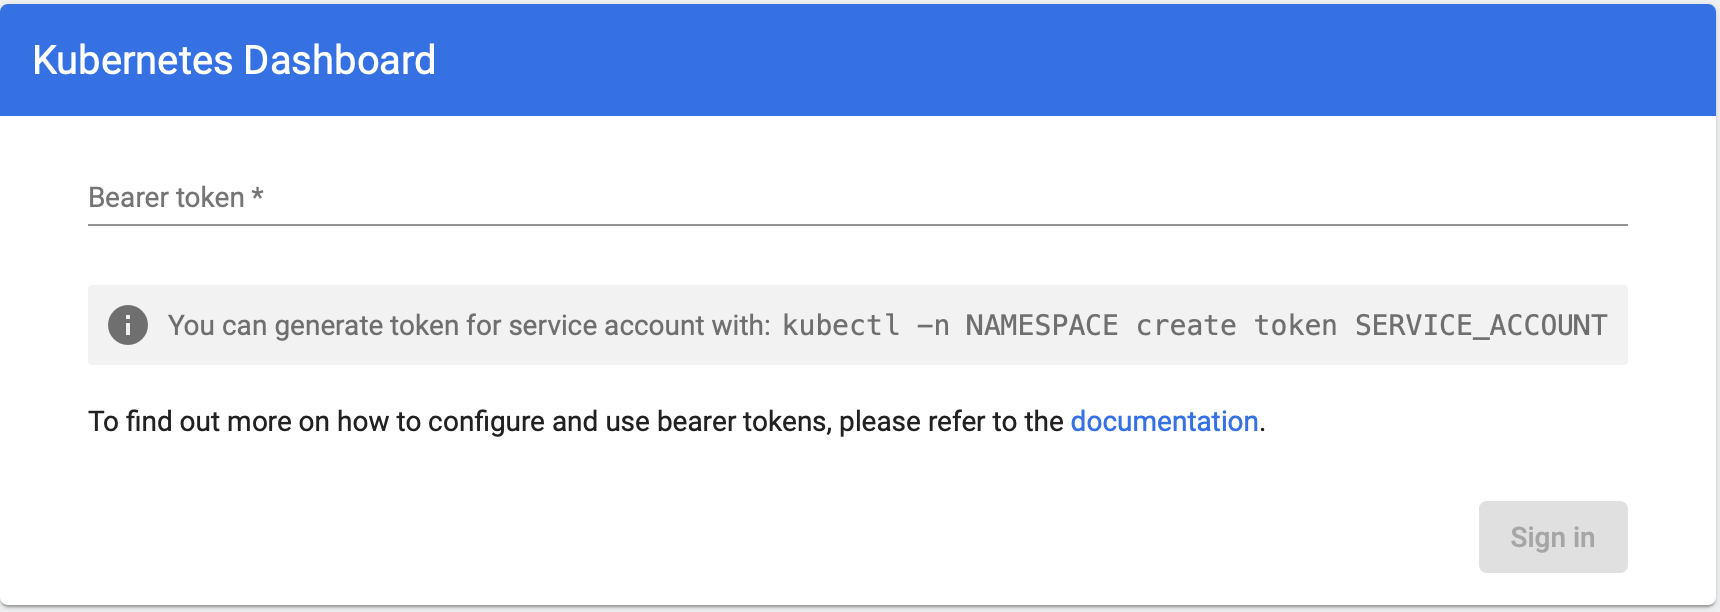
To access the Web UI (Dashboard), open your favorite browser and copy paste the URL: https://localhost:8443
-
Generate a Bearer Token for a Service Account:
Create a service account:$ kubectl create serviceaccount kubernetes-dashboard-admin -n kubernetes-dashboard
serviceaccount/kubernetes-dashboard-admin created
Create a service account using the yaml file:apiVersion: v1 kind: ServiceAccount metadata: name: kubernetes-dashboard-admin namespace: kubernetes-dashboard
$ kubectl apply -f kubernetes-dashboard-service-account.yaml -n kubernetes-dashboard
Create a cluster role binding:$ kubectl create clusterrolebinding kubernetes-dashboard-admin --clusterrole=cluster-admin --serviceaccount=kubernetes-dashboard:kubernetes-dashboard-admin
lusterrolebinding.rbac.authorization.k8s.io/kubernetes-dashboard-admin created
Create a cluster role binding using the yaml file:apiVersion: rbac.authorization.k8s.io/v1 kind: ClusterRoleBinding metadata: name: admin-user roleRef: apiGroup: rbac.authorization.k8s.io kind: ClusterRole name: cluster-admin subjects: - kind: ServiceAccount name: kubernetes-dashboard-admin namespace: kubernetes-dashboard
$ kubectl apply -f kubernetes-dashboard-cluster-role-binding.yaml -n kubernetes-dashboard
Generate a Bearer Token:$ kubectl create token kubernetes-dashboard-admin -n kubernetes-dashboard
eyJhbGciOiJSUzI1NiIsImtpZCI6ImNRSWpaaWtzSGprazQ...
-
Accessing the Dashboard UI remotely:
Forward the port 8443 from Windows into your Linux WSL distro.
The portproxy server listens for messages sent to a specific port and IPv4 address and maps a port and IPv4 address to send the messages received after establishing a separate TCP connection.
-
listenaddress: Specifies the IPv4 address for which to listen ("0.0.0.0" any IPv4 address).
-
listenport: Specifies the IPv4 port on which to listen ("8443").
-
connectaddress: Specifies the IPv4 address to which to connect ("172.26.110.211", this should be the address of your Linux WSL distro).
-
connectport: Specifies the IPv4 port to which to connect ("8443").
C:\Users\mtitek>netsh interface portproxy add v4tov4 listenaddress=0.0.0.0 listenport=8443 connectaddress=172.26.110.211 connectport=8443
To check the Port:
C:\Users\mtitek>netsh interface portproxy show v4tov4
Listen on ipv4:               Connect to ipv4:
Address Port                  Address        Port
------- ----                  -------        ----
0.0.0.0 8443                  172.26.110.211 8443
Add a new firewall rule to enable the port.
C:\Users\mtitek>netsh advfirewall firewall add rule name="Open Port 8443 - WSL 2" dir=in action=allow protocol=TCP localport=8443
To check the rule:
C:\Users\mtitek>netsh advfirewall firewall show rule status=enabled dir=in name=all | select-string -pattern "(LocalPort.*8443)" -context 9,4
Rule Name:           Open Port 8443 - WSL 2
-------------------------------------------
Enabled:             Yes
LocalPort:           8443
...
Start kubectl proxy command:
$ kubectl port-forward svc/kubernetes-dashboard-kong-proxy 8443:443 --address='0.0.0.0' -n kubernetes-dashboard
Forwarding from 0.0.0.0:8443 -> 8443
Handling connection for 8443
-
listenaddress: Specifies the IPv4 address for which to listen ("0.0.0.0" any IPv4 address).
C:\Users\mtitek>netsh advfirewall firewall delete rule name="Open Port 8443 - WSL 2"To delete the IPv4 port and address from the list of IPv4 ports and addresses for which the server listens:
C:\Users\mtitek>netsh interface portproxy delete v4tov4 listenaddress=0.0.0.0 listenport=8443